Analytics
Reports
Overview
Nifty exposes different sources of data with various metrics that can enable you to make informed decisions over your learning plan.
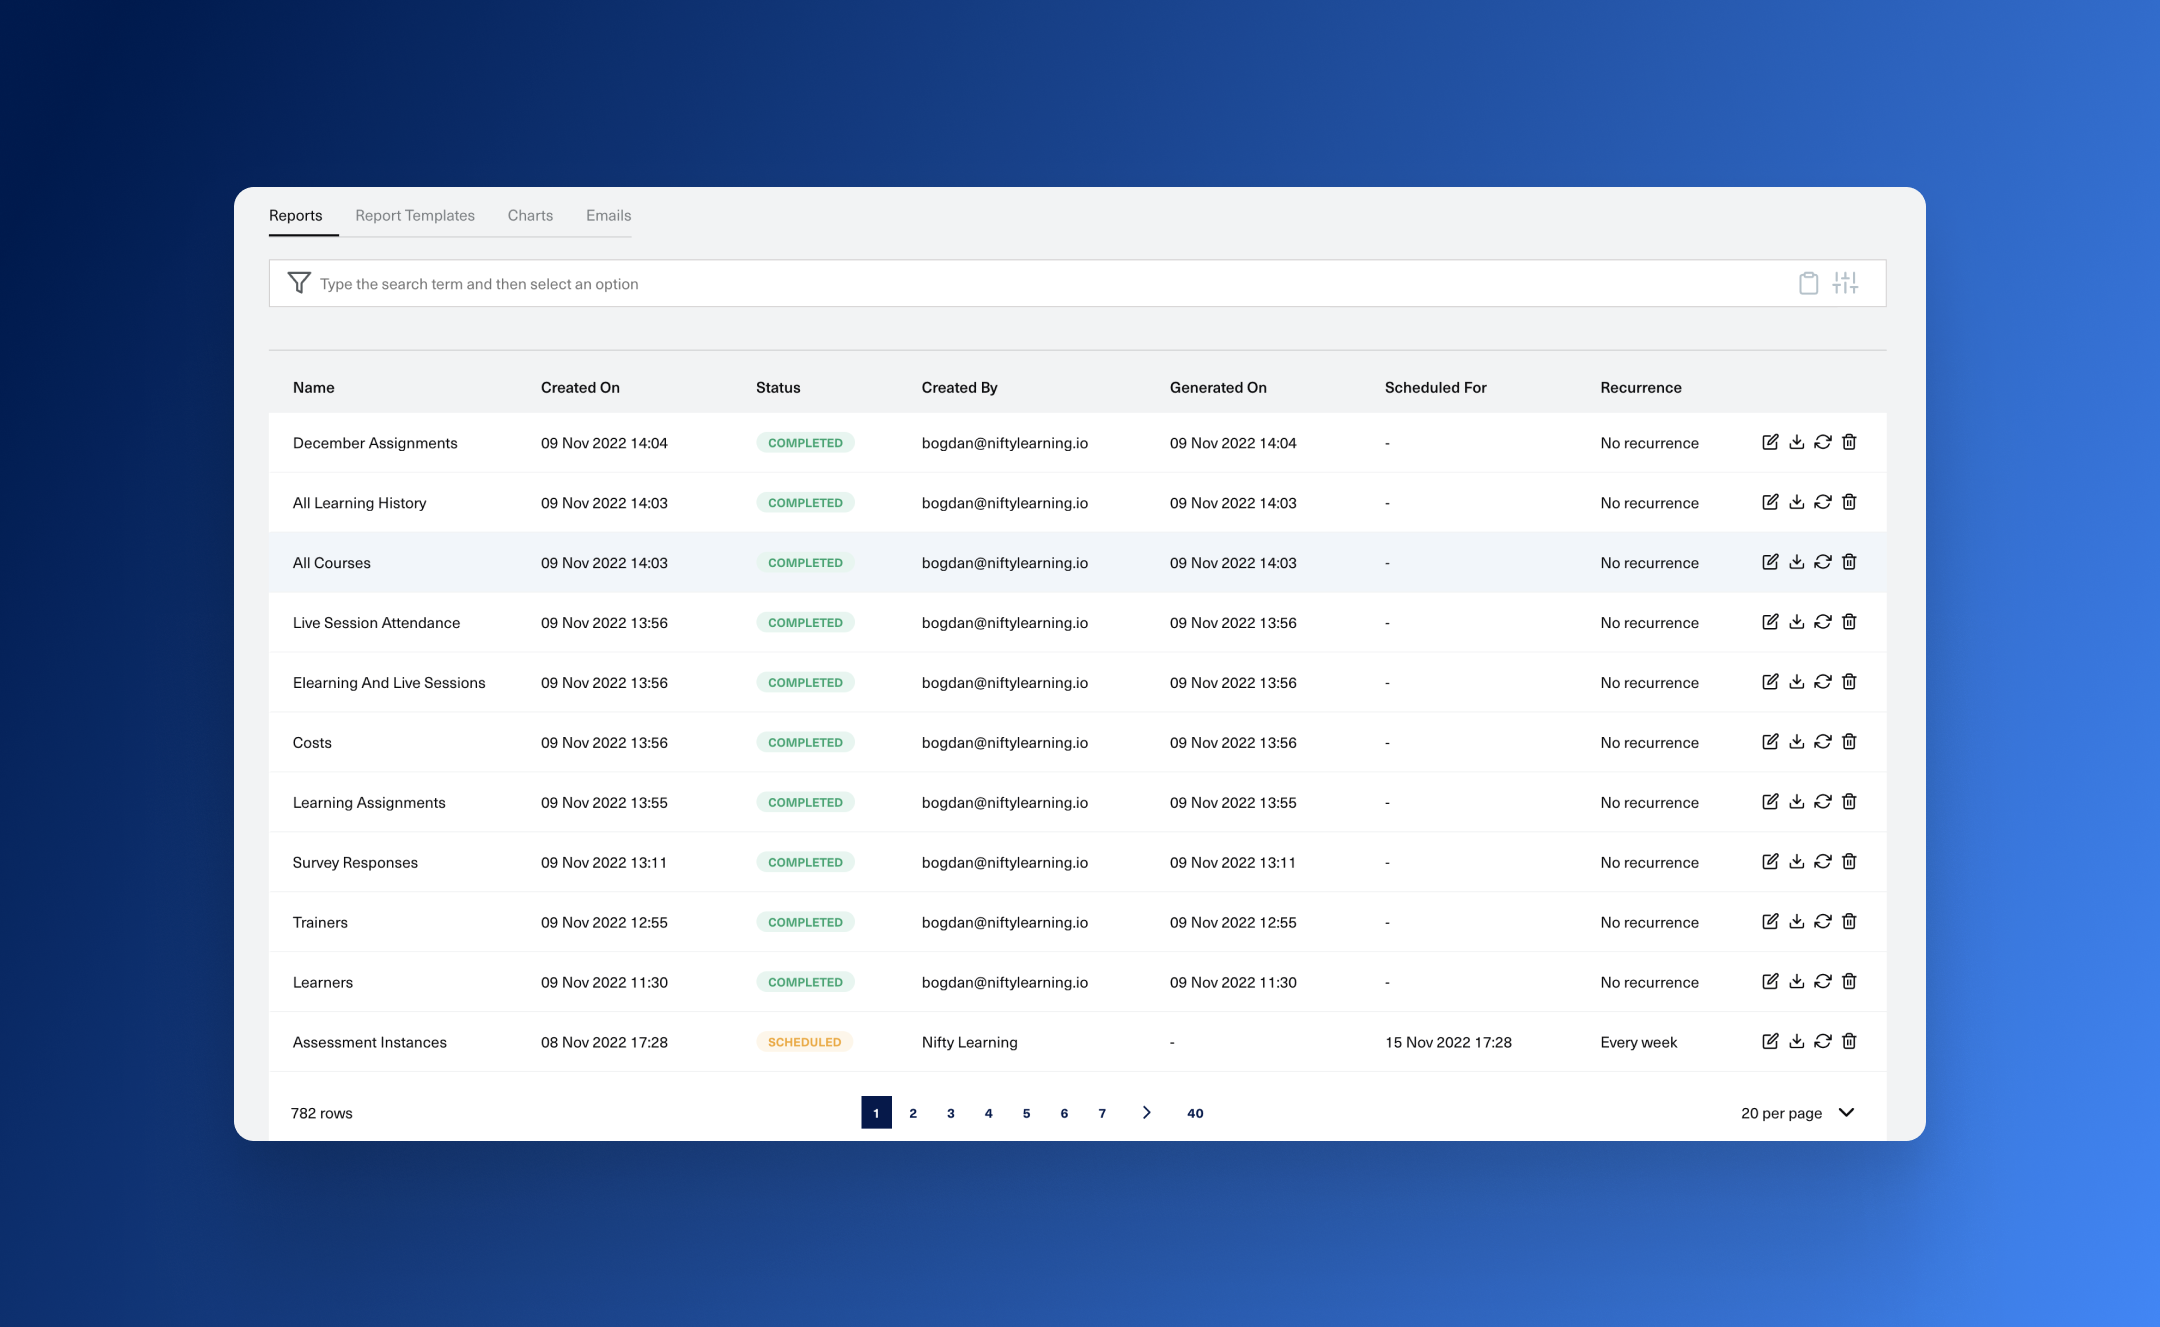
A report is basically the representation of a custom dataset that can be queried and written to an Excel file. Besides that you can specify custom identifiers, to have an easier time finding your report, schedule when should it be created, and customize who will receive it.
The datasets that you can choose from are defined through Report Templates. Using them tells you which entities (learners, courses, etc.) and specific metrics (cost per learner, completion percentage) will be outputted by your report. Nifty comes with a number of default report templates, but you can also build on top of them and create new ones tailored to your needs.
Report statuses
The process of creating a report uses different statuses to signal its state.
- Scheduled - The report will be created at a future date, specified in the Scheduled On column.
- In Progress - The report is currently being created. This signals that Nifty is currently querying your data and building the file. Based on the amount of data that you have this might take from a couple of seconds to a couple of minutes for huge data sets.
- Completed - The report was created and can be downloaded.
Permissions
By default, you can access only the reports that you have created. If you want other users to be able to see and download your reports you will have to include them in the Recipients list from the notifications section.
Reference Historical Learner Data
In some cases you might want to see the attributes of an employee at a specific point in time when the learning process happened. To do this you need to check the With historic learner data checkbox when generating a report.